파이썬. 데이터분석/Seaborn
Seaborn : plot xticks, yticks만 크기 조절하는법
한국수달보호협회장
2022. 7. 18. 21:44
https://stackoverflow.com/questions/42404154/increase-tick-label-font-size-in-seaborn
Increase tick label font size in seaborn
I have a huge problem with my seaborn plots. For some reason, the numbers along the axis are printed with a really small font, which makes them unreadable. I've tried to scale them with with plt.
stackoverflow.com
sns.set(font_scale = 2)는 모든 크기를 다 키운다. xticks, yticks만 띄우는 방법은 따로있다
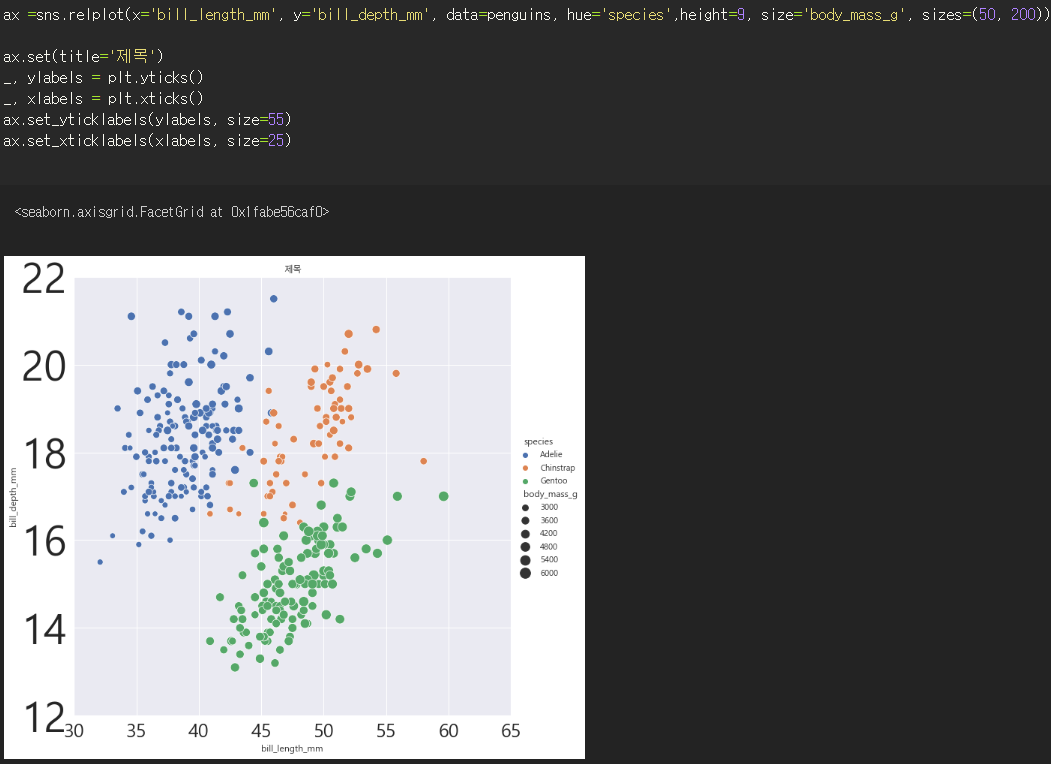
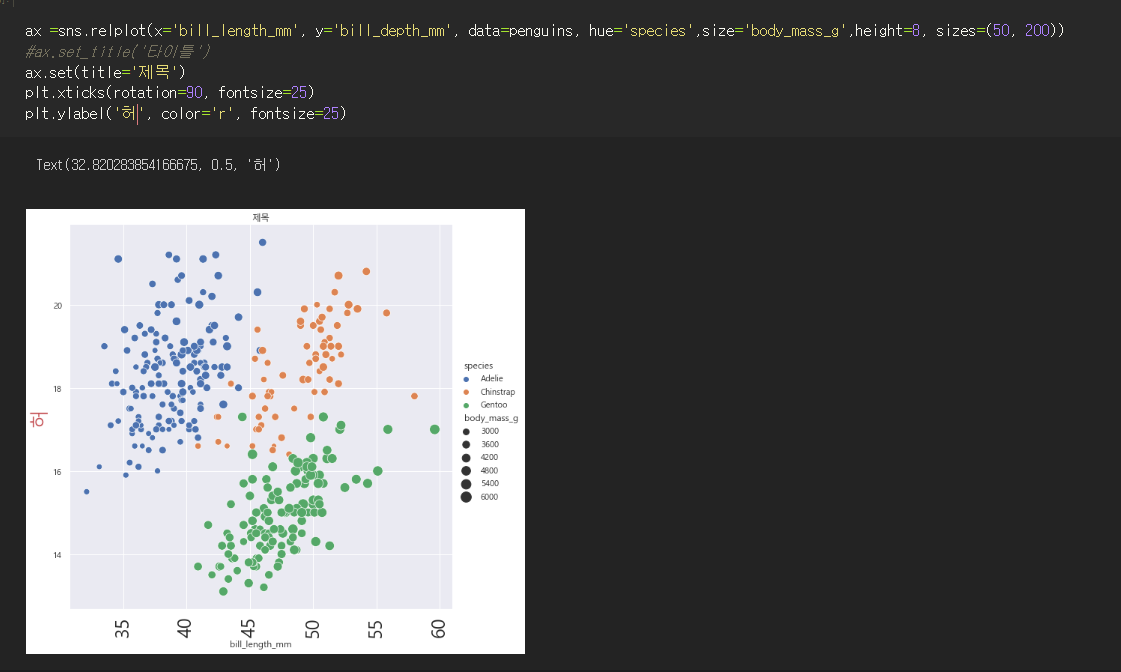
ax =sns.relplot(x='bill_length_mm', y='bill_depth_mm', data=penguins, hue='species',height=9, size='body_mass_g', sizes=(50, 200))
ax.set(title='제목')
_, ylabels = plt.yticks()
_, xlabels = plt.xticks()
ax.set_yticklabels(ylabels, size=95)
ax.set_xticklabels(xlabels, size=35)
그냥 plt.xticks, plt.ylabel 사용해도 되긴 함.