https://matplotlib.org/stable/api/_as_gen/matplotlib.pyplot.legend.html
matplotlib.pyplot.legend — Matplotlib 3.5.2 documentation
Place a legend on the Axes. The call signatures correspond to the following different ways to use this method: 1. Automatic detection of elements to be shown in the legend The elements to be added to the legend are automatically determined, when you do not
matplotlib.org
matplotlib 공식사이트가면 legend 위치에 대한 상세한 설명이있다.
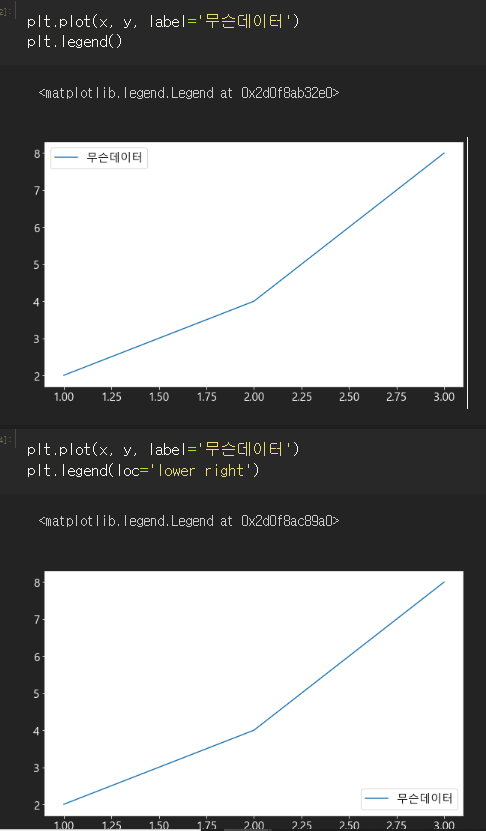
plt.plot(x, y, label='무슨데이터')
plt.legend(loc='lower right')
plt.plot(x, y)
plt.legend()라고치면 legend가 안뜬다.
plt.plot(x,y, label='무슨데이터') 이런식으로 label명칭을 정해줘야 legend가 뜬다
plt.legend(fontsize=18) 이런식으로 사이즈 조절 가능
plt.legend(loc=(0.4,0.6)) 디테일하게 위치 설정 가능
stateless방식
ax.legend(bbox_to_anchor=(1, 0.9),fontsize=18, loc='upper center', frameon=False, nocl=2)
ax.legend(fancybox=True, framealpha=1, shadow=True, borderpad=1)
'파이썬. 데이터분석 > Matplotlib' 카테고리의 다른 글
| matplotlib : 선 그래프 여러개 그리기 (0) | 2022.07.10 |
|---|---|
| matplotlib : 선그래프 색,marker, 배경색,linestyles (0) | 2022.07.10 |
| Matplotlib : 축 폰트, 색, 크기, 그래프 배경색 xticks.xlabel (0) | 2022.07.08 |
| groupby, 막대그래프 (0) | 2022.07.02 |
| fig, ax = plt.subplots : 여러 그래프 동시에 보여주기 1.(튜플형식) (0) | 2022.07.02 |


