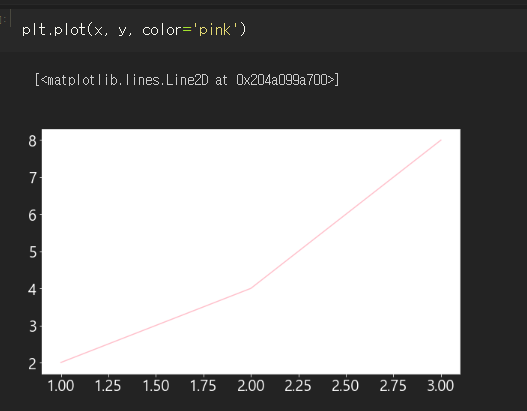
그래프 색 변경
plt.plot(x,y, color='pink')
약자로 그래프 설정
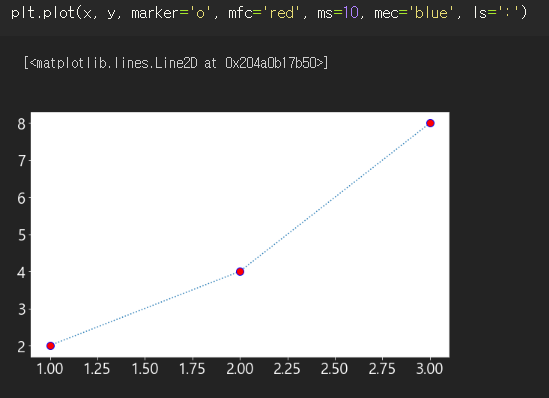
mfc = marker face color
ms = marker size
mec = marker edge color
ls = line style
plt.plot(x, y, 'ro--') 처럼 color, marker, linestyle을 동시에 지정할 수 있다.

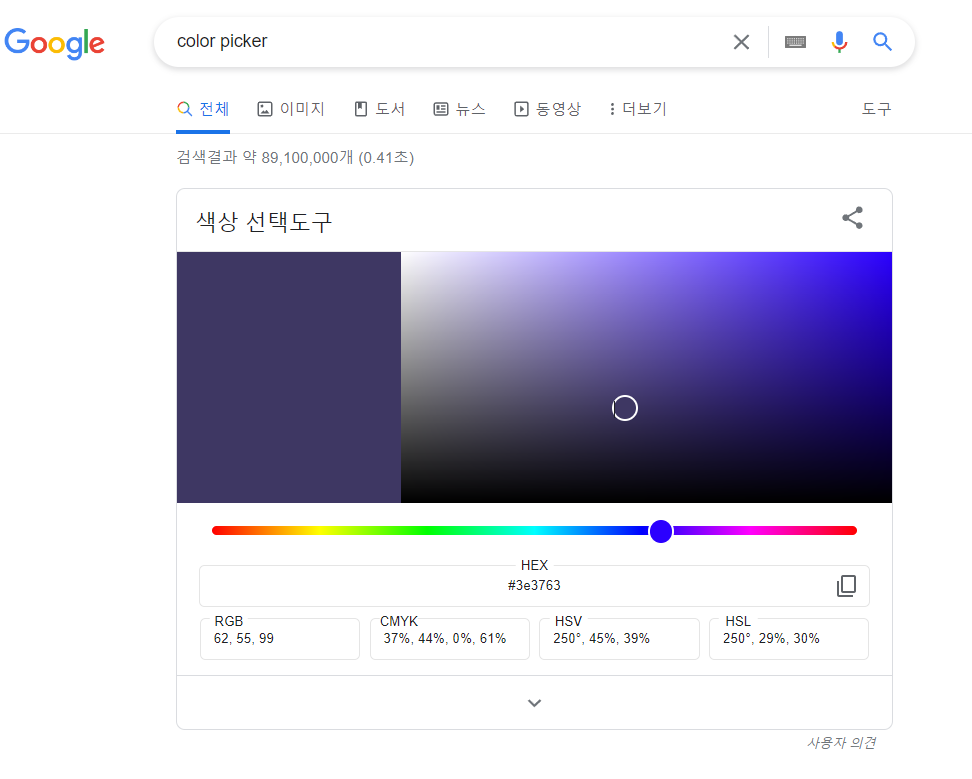
그래프 배경색도 설정가능하다, 마음에 드는 색을 찾고싶으면 구글에 color picker를 치면 hexcode,rgb를 알수있다.

https://matplotlib.org/stable/api/_as_gen/matplotlib.pyplot.plot.html
matplotlib.pyplot.plot — Matplotlib 3.5.2 documentation
An object with labelled data. If given, provide the label names to plot in x and y. Note Technically there's a slight ambiguity in calls where the second label is a valid fmt. plot('n', 'o', data=obj) could be plt(x, y) or plt(y, fmt). In such cases, the f
matplotlib.org

linestyles
'-' solid
'--' dashed
'-.' dashdot
':' ' dotted
'파이썬. 데이터분석 > Matplotlib' 카테고리의 다른 글
| 지금까지 배운거 복습 : enumerate, grid, legend (0) | 2022.07.11 |
|---|---|
| matplotlib : 선 그래프 여러개 그리기 (0) | 2022.07.10 |
| matplotlib : 범례(legend) (0) | 2022.07.09 |
| Matplotlib : 축 폰트, 색, 크기, 그래프 배경색 xticks.xlabel (0) | 2022.07.08 |
| groupby, 막대그래프 (0) | 2022.07.02 |


