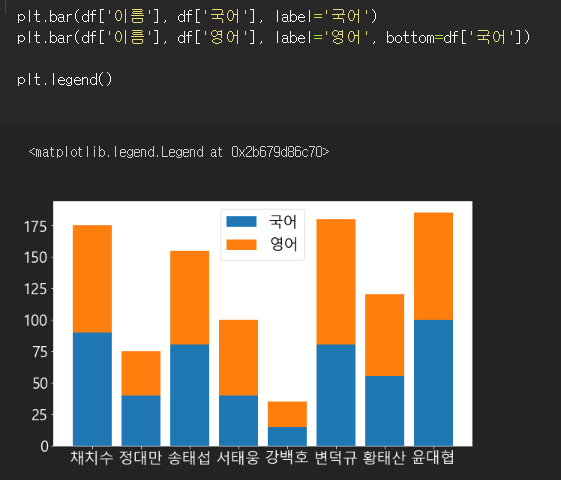
plt.bar(df['이름'], df['국어'], label='국어')
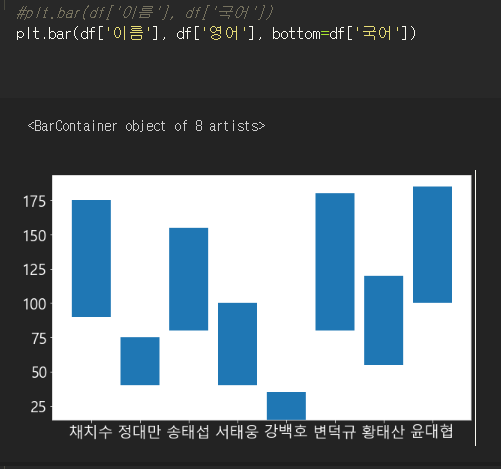
plt.bar(df['이름'], df['영어'], label='영어', bottom=df['국어'])
plt.legend()


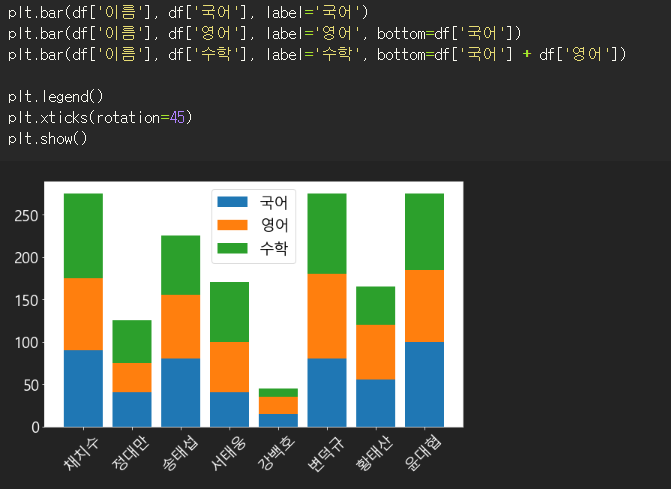
plt.bar(df['이름'], df['국어'], label='국어')
plt.bar(df['이름'], df['영어'], label='영어', bottom=df['국어'])
plt.bar(df['이름'], df['수학'], label='수학', bottom=df['국어'] + df['영어'])
plt.legend()
plt.xticks(rotation=45)
plt.show()

'파이썬. 데이터분석 > Matplotlib' 카테고리의 다른 글
| matplotlib : 원그래프(파이그래프) (0) | 2022.07.13 |
|---|---|
| matplotlib : 다중 막대 그래프 (0) | 2022.07.13 |
| matplotlib : 막대 그래프별 색,xticks (0) | 2022.07.12 |
| 지금까지 배운거 복습 : enumerate, grid, legend (0) | 2022.07.11 |
| matplotlib : 선 그래프 여러개 그리기 (0) | 2022.07.10 |


