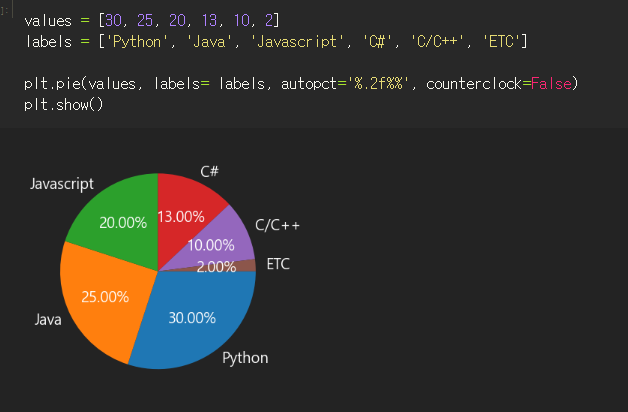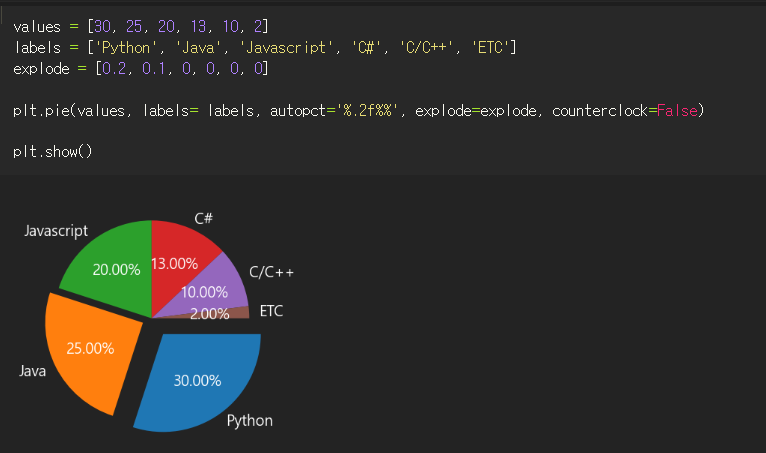
values = [30, 25, 20, 13, 10, 2]
labels = ['Python', 'Java', 'Javascript', 'C#', 'C/C++', 'ETC']
plt.pie(values, labels= labels, autopct='%.2f%%', counterclock=False)
plt.show()

values = [30, 25, 20, 13, 10, 2]
labels = ['Python', 'Java', 'Javascript', 'C#', 'C/C++', 'ETC']
explode = [0.05] * 6
plt.pie(values, labels= labels, autopct='%.2f%%', explode=explode, counterclock=False)
plt.legend()
plt.show()

values = [30, 25, 20, 13, 10, 2]
labels = ['Python', 'Java', 'Javascript', 'C#', 'C/C++', 'ETC']
explode = [0.05] * 6
plt.pie(values, labels= labels, autopct='%.2f%%', explode=explode, counterclock=False)
plt.legend(loc=(1.2, 0.3), title='언어')
plt.title('언어별 선호도')
plt.show()
'파이썬. 데이터분석 > Matplotlib' 카테고리의 다른 글
| matplotlib : plt.subplot 여러 그래프 동시에 보여주기 2 (0) | 2022.07.14 |
|---|---|
| matplotlib : 산점도 scatter (0) | 2022.07.14 |
| matplotlib : 다중 막대 그래프 (0) | 2022.07.13 |
| matplotlib : 누적 막대그래프 (0) | 2022.07.12 |
| matplotlib : 막대 그래프별 색,xticks (0) | 2022.07.12 |


