https://wooono.tistory.com/297
[Matplotlib] figure, subplot 차이
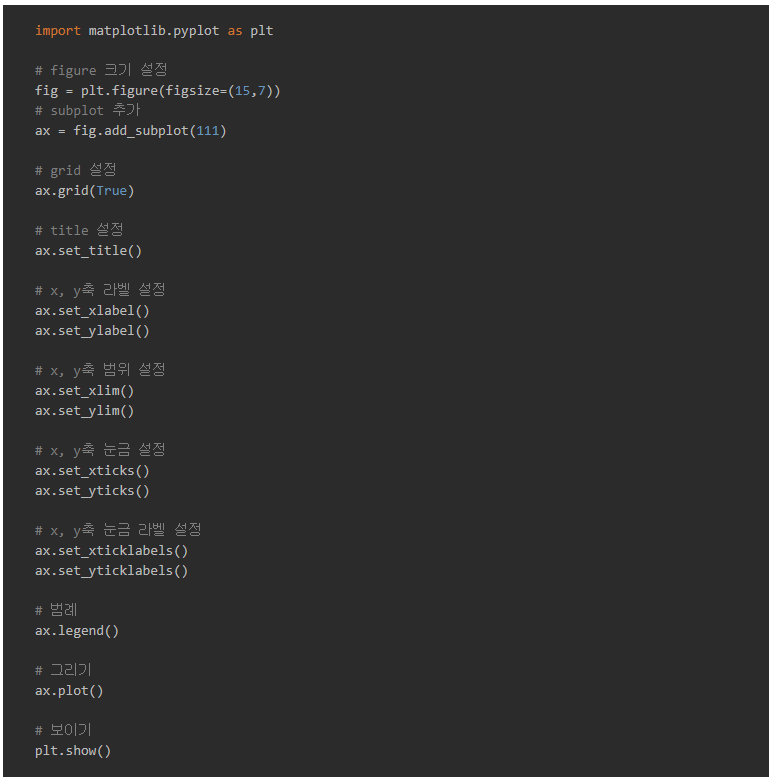
matplotlib.pyplot.figure reference https://matplotlib.org/3.1.1/api/_as_gen/matplotlib.pyplot.html example import matplotlib.pyplot as plt # figure 크기 설정 plt.figure(figsize=(15,7)) # grid 설정 p..
wooono.tistory.com

matplotlib.pyplot
plt.이후 메서드
https://matplotlib.org/stable/api/_as_gen/matplotlib.pyplot.html
matplotlib.pyplot — Matplotlib 3.5.2 documentation
Set the current rcParams. group is the grouping for the rc, e.g., for lines.linewidth the group is lines, for axes.facecolor, the group is axes, and so on. Group may also be a list or tuple of group names, e.g., (xtick, ytick). kwargs is a dictionary attri
matplotlib.org
'파이썬. 데이터분석 > Matplotlib' 카테고리의 다른 글
| ★Matplotlib 매개변수 총정리 - stateless(ax.) (0) | 2022.07.17 |
|---|---|
| ★Matplotlib 매개변수 총정리 - stateful (0) | 2022.07.17 |
| matplotlib : plt.subplot 여러 그래프 동시에 보여주기 2 (0) | 2022.07.14 |
| matplotlib : 산점도 scatter (0) | 2022.07.14 |
| matplotlib : 원그래프(파이그래프) (0) | 2022.07.13 |

