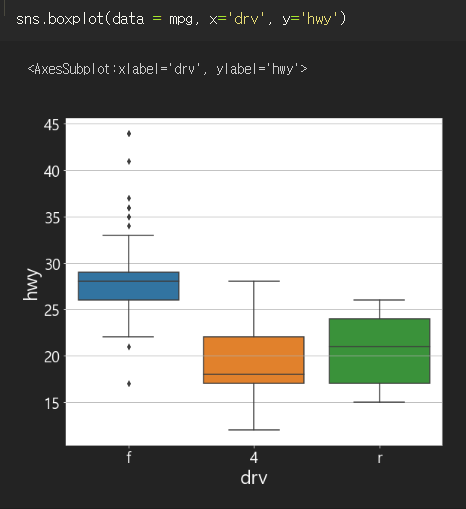
한번에 여러개 만들기
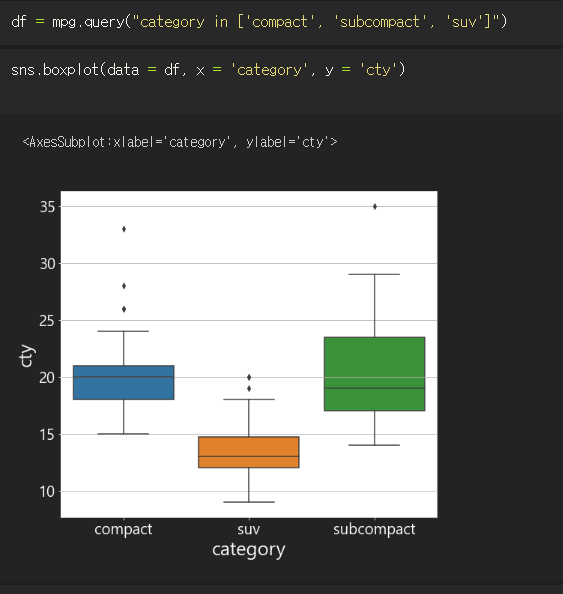
in list를 이용해서 원하는 데이터만 boxplot
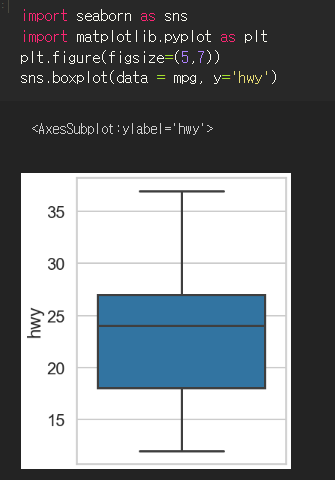
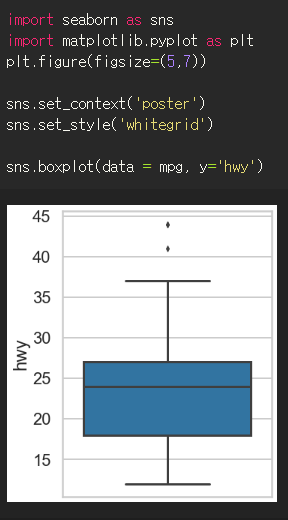
import seaborn as sns
import matplotlib.pyplot as plt
plt.figure(figsize=(5,7))
sns.boxplot(data = mpg, y='hwy')
sns.set_style('whitegrid')
sns.set_context('paper')
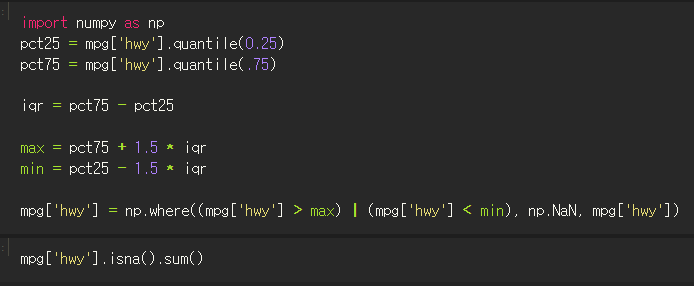
#이상값 제거
import numpy as np
pct25 = mpg['hwy'].quantile(0.25)
pct75 = mpg['hwy'].quantile(.75)
iqr = pct75 - pct25
max = pct75 + 1.5 * iqr
min = pct25 - 1.5 * iqr
mpg['hwy'] = np.where((mpg['hwy'] > max) | (mpg['hwy'] < min), np.NaN, mpg['hwy'])
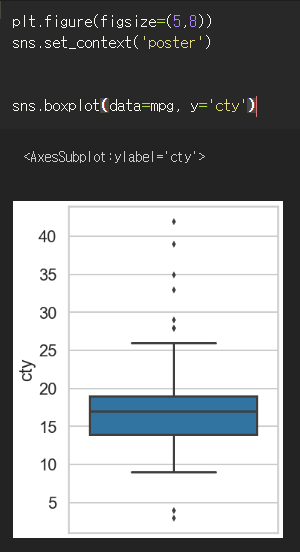
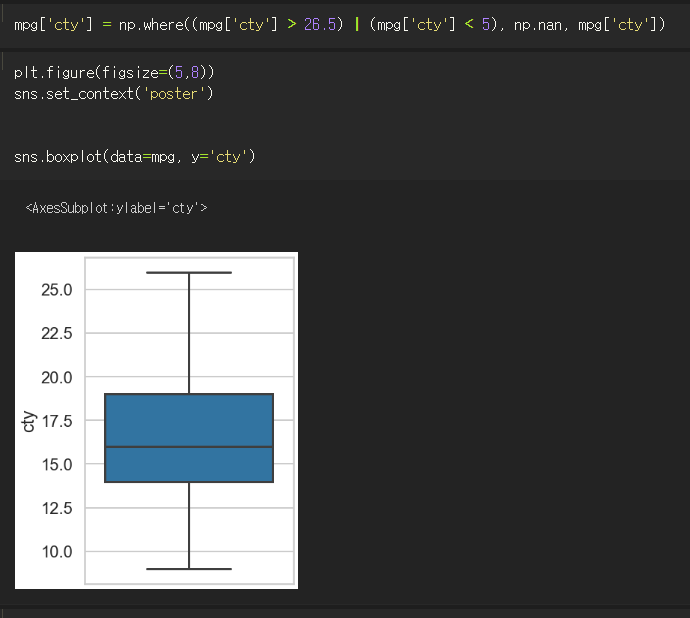
그냥 눈으로 대충보고 이상값 지우기
'파이썬. 데이터분석 > Seaborn' 카테고리의 다른 글
| Seaborn : sns.barplot (0) | 2022.07.30 |
|---|---|
| Seaborn : scatterplot xlim (0) | 2022.07.30 |
| ◆Seaborn : figure-level, axes-level 차이 (0) | 2022.07.19 |
| Seaborn : plot xticks, yticks만 크기 조절하는법 (0) | 2022.07.18 |
| Seaborn : relplot (hue,style,col,size) (0) | 2022.07.18 |


