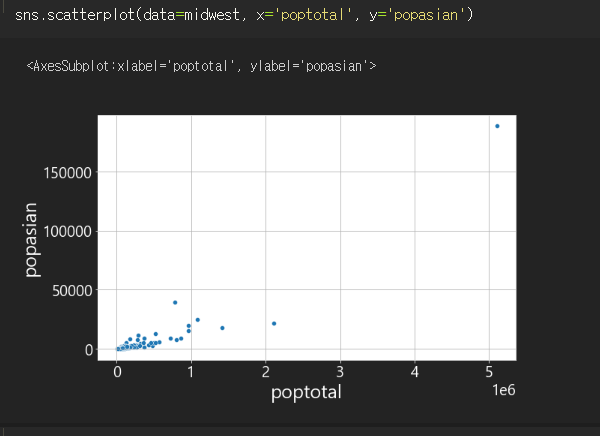
sns.scatterplot(data=midwest, x='poptotal', y='popasian')

sns.scatterplot(data=midwest, x='poptotal', y='popasian').set(xlim=(0, 500000), ylim=(0, 10000))

'파이썬. 데이터분석 > Seaborn' 카테고리의 다른 글
| Seaborn : sns.countplot (0) | 2022.07.30 |
|---|---|
| Seaborn : sns.barplot (0) | 2022.07.30 |
| Seaborn : boxplot, 이상값 제거(1.5IQR) (0) | 2022.07.28 |
| ◆Seaborn : figure-level, axes-level 차이 (0) | 2022.07.19 |
| Seaborn : plot xticks, yticks만 크기 조절하는법 (0) | 2022.07.18 |


